Implementation
The application is separated in
three main parts:
- The input
form where the online user determines the
necessary parameters for the application. The form has been implemented in
HTML with the support of javascript.
- The main
program that, according to the parameters set on the form, calculates the
barometric coefficient β. The procedure is performed
in PHP and the calculations are performed by sending SQL queries to the
NMDB mirror server.
- The graph
where the calculated values from the previous step are plotted. The graphs
are drawn by using the Jpgraph library which is
written in PHP (http://jpgraph.net). Apart from the points that are plotted,
the graph also shows the regression line, the slope of which corresponds
to the barometric coefficient of the station.
Input Form
At first, the user has to set the
time period for which the calculation of the barometric coefficient will be
performed. This is achieved by using the drop-down menu for’ Year’,’ Month’,’
Day’, ‘Hour’ and ‘Minute’ located in ‘From’ and ‘To’ sections. The user is free to select any combination of
beginning and ending dates.
After that, the user has to set the
resolution of the data that will be used in the calculation. This tool gives
the choice of selecting between hourly and daily data, using two radio buttons.
In the final step, the user selects
the station for which the barometric coefficient will be calculated. The
selection is performed by using the ‘Station’
dropdown menu. The second dropdown menu, labeled 'Support', is used in the case
the barometric coefficient will be calculated with the support of a reference
station. In the case the 'No Correction' choice is selected, the calculation
will be performed by only the station data.
Finally, the form allows the
possibility of a graph that plots the monthly values of the barometric
coefficient for a specified period of time. The selection of this graph is
performed via the ' Monthly Variation’ radio button under 'Plot type' section. In that case, only the year and the month of
the starting and ending dates are used. The selection criteria described above
are valid for this plot type as well. Due to performance reasons, the '1 hour'
resolution for the 'Monthly Variation' plot is limited to 5 years periods of
time. For longer periods the resolution is forced to '1 day'.
Output
The output graph has a .png image format. Since the graph is the output of the application, all the necessary information about the execution is displayed on it. The displayed information is given in the Table . A typical example of the barometric coefficient calculation without and with a reference station is given in Figs.1 and 2.
|
Station and Reference
Station (in case it exists) |
|
Resolution of data (1 hour or 1
day) |
|
NMDB tables that were used (1 hour or 1 minute) |
|
Barometric Coefficient (the slope of the
regression line) |
|
Standard Error of the linear regression |
|
Correlation Coefficient of the linear regression |
|
Number of
plotted points |
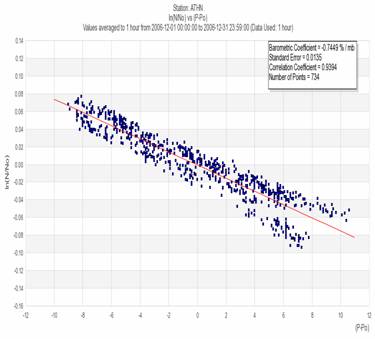
Figure 1: The barometric coefficient calculation during
December 2006 for
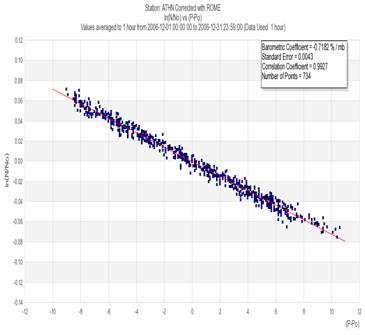
Figure 2: The barometric coefficient calculation during
December 2006 for Athens NM station using Rome station as a reference one
